Key takeaways
- A customer journey map is a visual representation of every step a customer takes when interacting with your brand, from first awareness through to loyalty, including what they do, think, and feel at each stage.
- Service blueprints go one layer deeper, adding the internal operations and employee actions that sit behind the customer-facing experience.
- Most journey maps are built in workshops without real participant input. The result is a map that reflects internal assumptions rather than actual customer behaviour.
- Mobile ethnography fixes this: participants capture videos, photos, screen recordings, and texts at each touchpoint in real time, giving you in-the-moment data before it's forgotten or post-rationalised.
- With Indeemo you can recruit from a global panel, run studies in 30+ languages, capture CSAT and NPS scores at each touchpoint, and analyse everything with AI.
What is customer journey mapping?
A customer journey map is a visual representation of every step a customer takes when interacting with your brand. It captures what they do, what they think, and how they feel at each stage, from the moment they first become aware of you through to purchase, loyalty, and advocacy. The goal is to understand the real customer experience, not the one your internal teams assume is happening.
Most maps are organised around phases (awareness, consideration, purchase, and so on), with individual touchpoints plotted at each stage. Alongside the actions, a journey map shows pain points, moments of delight, and the emotional highs and lows of the experience, often represented as a line graph running beneath the map.
Journey maps and service blueprints are related but different. Both plot a step-by-step story of a persona moving through an experience. Where a journey map focuses on what the customer sees and feels, a service blueprint also captures what happens behind the scenes to make that experience possible. More on that shortly.
What's the difference between a journey map and a service blueprint?
A journey map captures the front-stage experience, what the customer sees and feels. A service blueprint adds the back-stage layer, what your employees do and what internal processes support the customer experience at each step.
Journey maps are most common in UX and product teams. Service blueprints are the primary tool in service design and customer experience operations, where understanding the internal machinery behind the experience matters as much as the customer-facing journey.
Nielsen Norman Group, whose research on service design is widely referenced in the field, describes service blueprints as "companions to customer-journey maps" – they help organisations see the big picture of how a service is implemented alongside how it is experienced.
Key features of a journey map
A journey map follows one persona through a core workflow, broken into phases. Each phase has individual steps, and each step captures the actions, touchpoints, pain points, and opportunities at that moment. An emotional line runs through the journey showing how the customer feels from step to step – the highs and the lows. This is the "front stage" experience: everything visible to the customer.
Key features of a service blueprint
A service blueprint uses the same spine but adds swim lanes for back-stage activity. The front stage captures the customer experience. The back stage captures what employees do to deliver it. A third swim lane – opportunities – summarises where improvements can be made at each step. The blueprint also tracks the persona's status as it changes (from prospect to client, for example) and the internal processes that support each transition.
Nielsen Norman Group's research on service blueprinting in practice finds that design teams most commonly lead blueprinting initiatives, but the most effective ones involve cross-functional participation – product, research, engineering, customer support, and senior leadership.
What are the benefits of customer journey mapping?
Journey mapping produces better outcomes when it's grounded in real research. Before we get to the how, it's worth being clear on the why.
It uncovers real human problems
When you map a journey from real participant data – rather than workshop assumptions – you see the problems your customers actually face. Not the ones your product team expects, but the ones that cause real people to abandon a checkout, call support, or quietly switch to a competitor. Qualitative data surfaces specific friction: the moment someone can't find what they're looking for, the step where the language doesn't make sense, the gap between what the interface promises and what the customer gets.
It surfaces different customer personas
Not every customer takes the same path. People buying the same product can start their research differently, move through different channels, and hit different pain points. Journey mapping makes these variations visible. As you track real participants, diverging paths and distinct behaviours emerge – and with them, the customer personas that should be shaping your product and service decisions.
It builds empathy across the organisation
There's a real difference between being told customers find a process frustrating and watching someone on video actually struggling with it. Multimedia data – video, photos, screen recordings — brings the customer experience to life in a way a slide deck of survey scores can't. Teams that have watched real participant footage tend to make different decisions than teams that haven't.
It breaks down silos and supports prioritisation
Building a journey map forces cross-functional alignment. Marketing, product, design, and customer service rarely share the same view of the customer experience. A journey map creates a shared artefact that everyone works from. It makes it easier to identify high-impact, low-effort improvements — and harder to argue that problems in someone else's swim lane aren't your concern.
Why do so many journey maps get it wrong?
Journey mapping's potential is real, but the method is only as good as the data behind it. In practice, a lot of journey maps are built on shaky foundations.
The most common problem is time pressure. Journey maps are often co-created internally – a workshop with the product team, a few sessions with customer-facing staff, some survey data pulled from a CRM. The intent is good. The result is a map that reflects what your internal teams believe is happening, not what customers actually experience.
Co-creation workshops have a second weakness: group dynamics. Some voices dominate. Others hold back. Key information – the kind that lives with one person who knows a particular part of the process better than anyone – gets missed or softened in the consensus. The map can end up reflecting the loudest voice in the room rather than the collective reality.
Then there's the recall problem. Even well-intentioned interviews with real customers can't fully capture what happened in the moment. Memory is unreliable. Research on recall bias shows that people consistently misremember events, omit details, and reconstruct experiences rather than accurately reporting them – especially as time passes. A customer describing their purchase journey from last week is already post-rationalising. The friction they felt but moved past, the moment of hesitation before they clicked, the competing app they briefly considered – these details disappear fast.
The result is maps that look plausible and get presented with confidence, but don't hold up when you compare them to what customers actually do.
How does mobile ethnography support customer journey mapping?
Mobile ethnography addresses the problem directly. Instead of asking customers to recall their experience, you ask them to document it as it happens – using the smartphone they already carry everywhere.
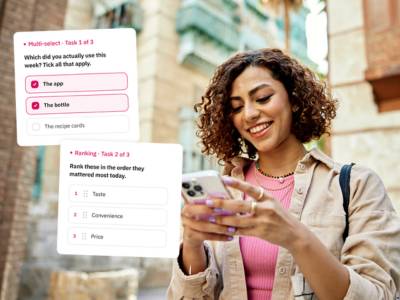
Participants get tasks that correspond to each stage of the journey. They record videos, take photos, capture screen recordings, and write text entries as they move through each touchpoint in real time. A customer buying a new appliance records their first awareness moment, their product research, their in-store visit, the unboxing at home. A patient documents their experience from GP referral through to a clinic appointment. A business buyer logs every interaction across a multi-week procurement process.
All of it lands in a researcher dashboard as it happens. No travel required, no scheduling, no waiting for everyone to be in the same room at the same time.
Capturing the emotional journey
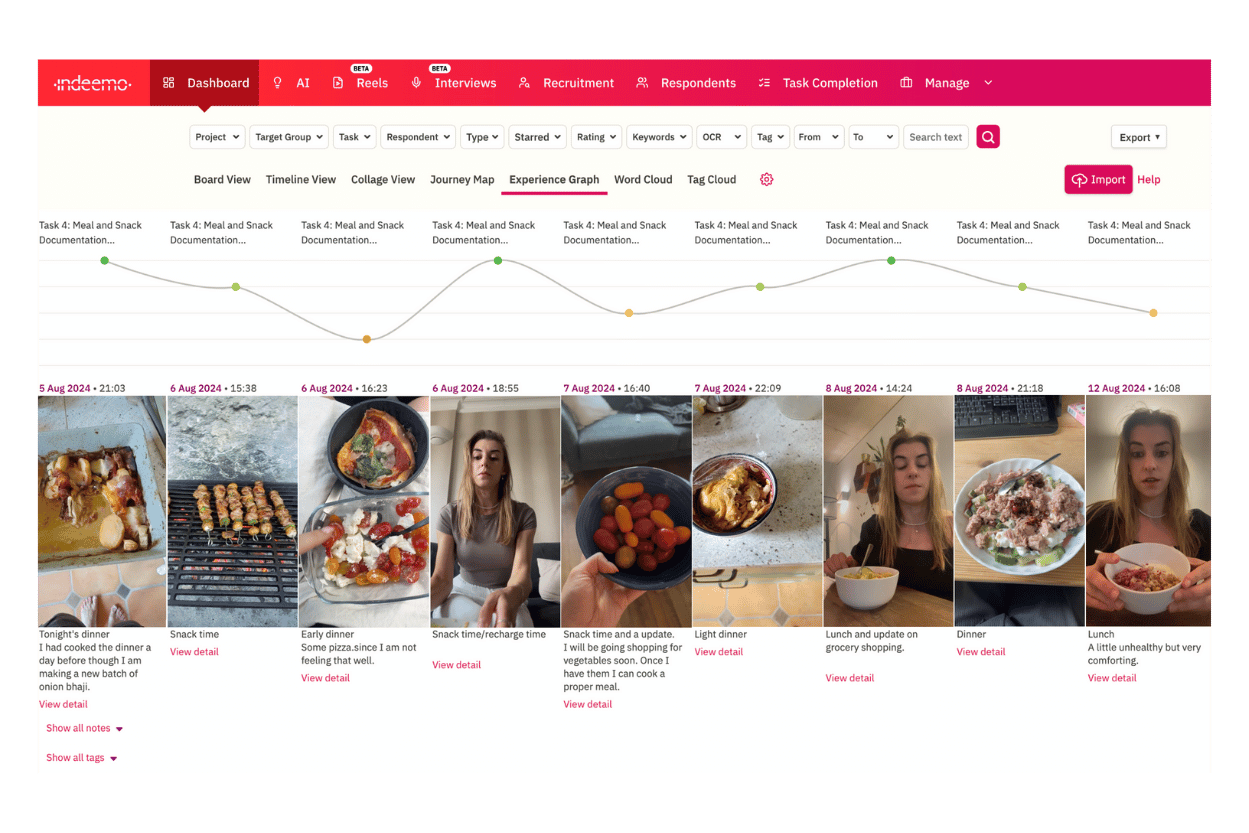
Indeemo participants can self-report CSAT and NPS scores at each touchpoint. The platform automatically plots these into a visual customer experience graph, showing the emotional highs and lows of the journey in real time. Customers rate how they feel right now – not how they think they felt in retrospect. That distinction matters.
The graph makes it straightforward to spot moments of delight and, more importantly, the quieter pain points that don't always reach customer support – the small frustrations that erode satisfaction without anyone flagging them.
No researcher effect
In-person ethnography changes the situation it's trying to study. A researcher shadowing a customer through a shopping trip influences how that customer behaves. Mobile ethnography removes the physical observer. Participants record in their own environment, on their own schedule, without anyone watching. The data is closer to what people actually do.
For a deeper look at the method itself, see our guide to mobile ethnography.
How do you use mobile ethnography to co-create a journey map?
Mobile ethnography doesn't just improve the quality of data that feeds into a journey map. It can support the entire co-creation process – from initial recruitment through to final sign-off.
Here's how it works in practice.
1. Define scope and recruit participants
Start by identifying your persona and scoping the high-level journey stages. Then recruit.
Gathering everyone in one place at one time is logistically hard, especially when key participants are subject matter experts or senior stakeholders with full diaries. Mobile ethnography removes that constraint. Participation is asynchronous – SMEs and stakeholders contribute around their own schedule rather than clearing a full day for a workshop. Indeemo's global panel of 3 million+ participants also means you can recruit customer-side participants quickly, wherever they are.
2. Validate journey stages and discover steps
Task participants individually to validate the high-level stages and fill in the detailed steps within each one. Individual tasking bypasses group dynamics: each person expands on their own area of expertise without being steered by what someone else said first. You get the unfiltered version of what they know.
3. Build and iterate the map
With data coming in, start plotting it into a low-fidelity journey. There will be contradictions and gaps – that's expected, and it tells you where you need more data. Indeemo's filtering and tagging tools make it easy to search across all submissions for specific details. CSAT and NPS scores aggregate automatically, showing the emotional shape of the journey across your full participant group.
4. Align and refine
Share the draft journey with all participants and ask for their reaction. This is where people who've been working in silos see the full picture for the first time — and where small discrepancies surface. With mobile ethnography, participants can review the draft and record a video response as they walk through it. You get facial expressions, tone of voice, and detailed commentary that a written comment can't match.
5. Finalise and archive
Once validated, move the content into the final high-fidelity format. All recordings, transcripts, and emotional data are automatically archived within the Indeemo project — ready to reference, share with stakeholders, or use as a baseline when you run the study again.
What are the benefits of service blueprints for business operations?
Service blueprints produce value during the process of building them as well as in the finished deliverable.
Building one forces conversations across teams that don't normally talk to each other. Departments that have been operating in silos start to see how their work connects to the customer experience — and where handoffs between them create friction. Nielsen Norman Group's five-step blueprinting guide notes that the process itself generates alignment and can surface high-impact, low-effort improvements before the blueprint is even finished.
The finished document captures the current state of the business through the customer's lens – which makes it possible to design a future state that addresses known pain points rather than hypothesising about them. Organisations can use it to identify commercial opportunities, support prioritisation, and track ROI as they implement changes.
A well-maintained service blueprint is also one of the more practical onboarding tools a business can have. New employees see not just what their role involves, but how it connects to the wider customer experience.
Who uses customer journey mapping and service blueprints?
Journey maps and service blueprints get used across industries and research disciplines.
UX and product teams use journey maps to understand how users move through digital products – where they get stuck, where they drop off, and where design decisions are creating friction that quantitative data alone doesn't explain.
CX and marketing teams use journey mapping to understand the full path to purchase across digital and physical channels. Omni-channel journeys are rarely linear, and a map built from real customer data shows the actual sequence of touchpoints – not the intended one.
Service design teams use service blueprints to redesign internal operations around the customer experience. The blueprint shows where employee-facing processes are creating customer-facing problems, and aligns cross-departmental work around fixing them.
Healthcare and pharma researchers use journey mapping to understand patient experiences outside clinical settings – from initial symptoms and GP appointments through to treatment and recovery. Capturing these journeys in context gives clinicians a view of the patient experience that clinic visits alone can't provide.
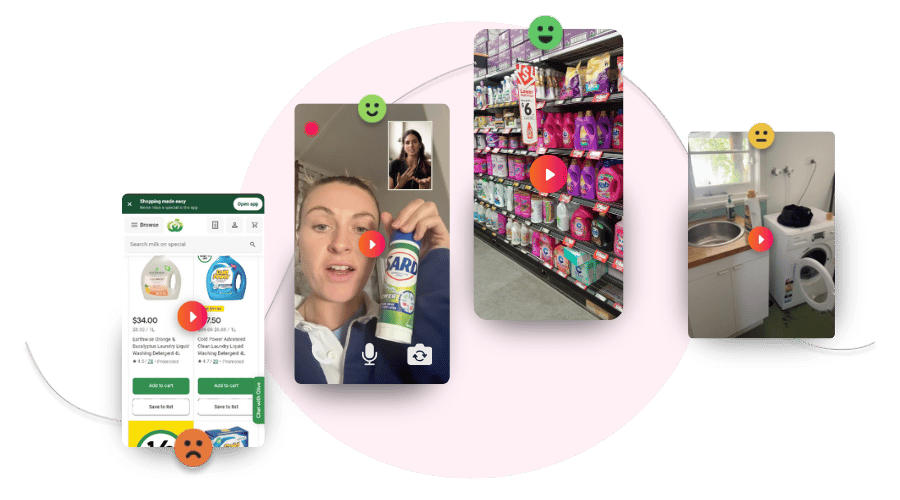
Retail and e-commerce teams use journey mapping for shopper research: understanding how customers move between online browsing, in-store visits, and final purchase decisions. Screen recording with voice-over is particularly useful here – you see exactly how someone navigates a website while hearing what they're thinking.
For more on path-to-purchase research, see our consumer purchase journey guide.
Do you need to be a researcher to run a journey mapping project?
No. Whether you're an experienced UX researcher, a CX team at a global brand, or a business exploring journey mapping for the first time, Indeemo can support you.
Use the platform independently if you have the expertise in-house. Or partner with our Catalyst team for study design, recruitment, moderation, analysis, or the full project. If you have research ambitions but not the bandwidth to run the project yourself, we can step in wherever it's useful.
We've supported journey mapping projects across sectors – from path-to-purchase studies for consumer goods to patient journey research in healthcare. Platform or partnership, we can work either way.
Frequently asked questions
What's the difference between a customer journey map and a service blueprint?
A customer journey map captures what the customer sees, does, and feels at each touchpoint. the front-stage experience. A service blueprint adds the internal operations and employee actions that support that experience behind the scenes. Think of a service blueprint as the sequel to a journey map: you build the customer journey first, then use it as the foundation for mapping what your organisation needs to deliver it.
How many participants do you need for a journey mapping study?
Most studies work well with 15 to 30 participants, though this depends on the complexity of the journey and how many distinct personas you're mapping. Because mobile ethnography captures rich, longitudinal data from each participant across multiple touchpoints over time, you often need fewer people than you'd expect before clear patterns start to emerge.
Can you run journey mapping research remotely?
Yes – and for most projects, remote is the better approach. Mobile ethnography lets participants document each touchpoint in their real environment, at the moment it happens, without a researcher present. You get more authentic data than in-person observation, with less disruption to natural behaviour.
What's the difference between a journey map and a process map?
A process map documents internal business processes – the steps your organisation takes to deliver a product or service. A journey map documents the customer's experience of those interactions. What looks efficient internally can still produce a poor customer experience. Journey maps are built from customer data; process maps from operational data.
How long does a journey mapping study take?
Field time typically runs from one to four weeks, depending on the complexity of the journey. A focused path-to-purchase study might run for five to seven days. A more complex healthcare or B2B procurement journey might run for three to four weeks. AI-powered transcription and analysis on the back end mean turnaround from fieldwork to initial findings is faster than it used to be.